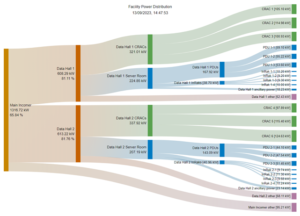
Sankey Diagram functionality added to ACIS Power Monitoring System
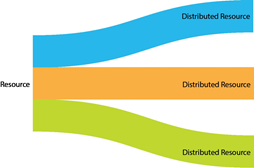
Airedale are pleased to announce the release of the ACIS™ Sankey Diagram: a powerful visualisation tool for facility power usage offered as part of the ACIS™ Building Management System. A Sankey diagram is used to visualise the “flow” of a resource, as it is distributed among a network of downstream systems. The width of the arrows is proportional to the flow rate of the values as they feed through the network, helping to locate the most important contributions to a flow.
Sankey Diagram
The ACIS™ Sankey Diagram is the latest feature to be added to the Power Monitoring System (PMS) suite, providing a dynamic, intuitive new way to understand facility power usage.
ACIS Sankey Diagram
The ACIS PMS Sankey Diagram allows facility owners and operators to see power flows throughout the entire system, delivering a holistic view of what processes and plant are consuming the most power at any given time.
Greater understanding of power usage in this way can deliver insights into improving efficiencies, which can lower both costs and environmental impact. In a data centre environment, for example, uneven power usage across CRAH units in one data hall can be a symptom of component issues within a CRAH unit, or an indicator that the space is not being cooled in an optimum way. Sankey diagrams also provide information and clarity on where system losses are occurring.
Features:
• Integrates with ACIS™ Building Management Systems
• Dynamic view of facility power usage
• Capacity utilisation display
• Customisable colour theme
• User configurable flow paths
About the ACIS PMS
Power Management Systems may not be the first thing that come to mind when you think of Airedale, but we believe that we have developed a system that goes far beyond any on the market today.
The ACIS PMS does everything you expect an industry leading power monitoring system to do, including monitoring of all HV and LV devices from any manufacturer, electrical power totalisation across the system, live power schematics and insightful reporting tools. Operators can view live and historical Power Usage Effectiveness (PUE) of the facility in order to track changes and maintain Tier classification.
Where ACIS PMS delivers above and beyond standard systems, is in its analysis of power events like equipment failures. ACIS PMS accurately ascertains the root cause of electrical events, such as cascading trips, with 1ms time stamping of events. It allows users to cut through the noise of lists with graphical representation of trips vs. time, allowing the user to see “hot spots” of anomalous activity and assess magnitude of events. On top of this, ACIS PMS then creates plots of electrical events on a CBEMA curve (event duration & Voltage magnitude), allowing user to quickly prioritise serious events.
For more details, please email: [email protected]


